ElasticSearch初探(一)
本博客所有文章采用的授权方式为 自由转载-非商用-非衍生-保持署名 ,转载请务必注明出处,谢谢。
背景
为了进一步熟悉掌握ElasticSearch的相关原理,本文尝试了手动安装ElasticSearch和基于k8s的方式安装,并且探索了监控ES的相关方法
安装部署
主要分为2种方式,常规的linux安装和基于kubernets部署,会分别说明
本次测试用 ElasticSearch7.4版本,官网下载
linux安装
基于ubuntu16.04
运行ES的用户不能用root用户,需要单独创建
-
添加ES用户
groupadd elk useradd elk -g elk -p 111111 上面设置用户密码的命令好像并不生效,需要手动再设置下 elk用户的密码 -
准备JDK环境
我们8.0产品已经自带JDK 1.8版本,所以不需要单独安装
备注:在centos7的环境发现,ES7.4版本中自带JDK,所以可以无需单独再安装JDK,但是该版本在我们8.0产品上运行有问题,所以我们8.0产品需要单独配置JDK,后面会专门说明
-
将ElasticSearch7.4的java压缩包 cp到各个节点的elk用户目录,并解压
elk@node2:~/elasticsearch$ pwd /home/elk/elasticsearch elk@node2:~/elasticsearch$ ll drwxr-xr-x 10 elk elk 4096 Dec 30 16:05 elasticsearch-7.4.1/ -rw-r--r-- 1 elk elk 487116800 Oct 31 16:01 elasticsearch-7.4.1-linux-x86_64.tar elk@node2:~/elasticsearch$ -
配置JDK环境
我们8.0产品已经自带JDK,需要配置 ES使用该JDK
步骤主要分为2步,如下
1,确定本地java的安装路径 一般位于如下路径 elk@node1:~/elasticsearch/elasticsearch-7.4.1$ ll /usr/lib/jvm/ total 16 lrwxrwxrwx 1 root root 20 Jul 19 2019 java-1.8.0-openjdk-amd64 -> java-8-openjdk-amd64/ -rw-r--r-- 1 root root 2714 Jul 19 2019 .java-1.8.0-openjdk-amd64.jinfo drwxr-xr-x 5 root root 4096 Dec 28 12:08 java-8-openjdk-amd64/ 知道了上面的路径后,一般会手动创建一个软链接,方便后续的其他配置,命令如下: ln -s /usr/lib/jvm/java-8-openjdk-amd64/ /usr/lib/jvm/java 检查软链接效果 lrwxrwxrwx 1 root root 34 Dec 30 14:45 java -> /usr/lib/jvm/java-8-openjdk-amd64// 2,配置elk用户下的JAVA_HOME 环境变量 elk@node2:~/elasticsearch$ vim ../.bashrc 增加如下配置: JAVA_HOME=/usr/lib/jvm/java export JAVA_HOME PATH=$PATH:$JAVA_HOME/bin -
修改linux 内核参数
我们8.0产品已经修改好,无需额外修改
备注:centos7环境需要修改如下:
vim /etc/security/limits.conf 增加如下配置
*               soft    nofile           65536
*               hard    nofile           65536
修改后验证
[root@esNode2 ~]# ulimit -Hn;ulimit -Sn
65536
65536


另外,jvm的参数修改如下:
[root@esNode2 ~]# sysctl -w vm.max_map_count=262144
vm.max_map_count = 262144
永久修改
echo "vm.max_map_count=262144" > /etc/sysctl.conf
-
配置ES
elk@node2:~/elasticsearch/elasticsearch-7.4.1$ pwd
/home/elk/elasticsearch/elasticsearch-7.4.1

elk@node2:~/elasticsearch/elasticsearch-7.4.1$ vim config/elasticsearch.yml
elk@node2:~/elasticsearch/elasticsearch-7.4.1$ grep -v "^#" config/elasticsearch.yml
cluster.name: wsg-es
node.name: node2
network.host: 0.0.0.0
discovery.seed_hosts: ["172.17.73.61", "172.17.73.62", "172.17.73.63"]
cluster.initial_master_nodes: ["node1"]
备注: 配置项包括
集群名称
该节点名称
允许哪些网络来访问ES,0.0.0.0 表示可以通过主机的任意网络来访问
集群中有哪些节点
-
启动ES
[elasticsearch@esNode2 elasticsearch-7.4.1]$ bin/elasticsearch -d OpenJDK 64-Bit Server VM warning: Option UseConcMarkSweepGC was deprecated in version 9.0 and will likely be removed in a future release. [elasticsearch@esNode2 elasticsearch-7.4.1]$ vim logs/wsg-es.log [elasticsearch@esNode2 elasticsearch-7.4.1]$ ll 看起来 启动正常 时,也会有上面的一条告警。。 -
配置和启动kibana
kibana的版本需要和ES的版本一致,否则无法使用,kibana可以和ES进程部署在一起,也可以单独部署在其他机器上,这里是单独部署在 centos上。
配置文件
[elk@esNode1 elasticsearch]$ cat /etc/kibana/kibana.yml |grep -v "^#"

server.host: "0.0.0.0"
elasticsearch.hosts: ["http://172.17.73.61:9200"]
[elk@esNode1 elasticsearch]$
启动kibana
/etc/init.d/kibana start

注意: 测试过 通过 systemctl命令去启动,不知为啥 web一直无法访问。
systemctl enable kibana
systemctl start kibana
基于kubernets安装
本质就是通过k8s的operator模式来控制ES集群。尝试官方最新的ECK的版本,无法正常跑起来。回退到0.8的版本,可以跑起来,但是该版本的pod配置采用的是 hostdir的方式(pod重启会导致数据无法保存),所以临时测试可以跑一下。限于pi’a详细的步骤会在后续的blog中更新出来。
期待后续 官方可以有更正式的 ECK版本,
#运维监控方案
需要监控的指标包括集群层面,节点层面的相关信息,比如集群层面:集群状态,index 和shard状态,index和query效率;节点层面的JVM资源消耗情况,cpu,内存,磁盘,网络等。
考虑到当下prometheus比较流行,并且支持丰富的应用插件,所以优先考虑用prometheus来做。但是实践下来之后,发现虽然又elasticSearch exporter的监控插件,但是提供的指标太多,无法方便快捷的整理到一个dashboard上来观看。 对比ES自己开源出来的x-pack插件,x-pack就有更多优势,比如无需额外安装,相关指标已经整理归类,方便查看。(这里要感谢极客时间的专栏,Elasticsearch核心技术与实战,给出了有益的参考 )
prometheus 解决方案
部署 elasticSearch exporter
nodeExport
JVM
elastic exporter 既可以安装在 elastic search 集群之外,也可以以 插件的方式 安装 在 elastic search 集群
本次测试 是通过 k8s 上的 elastic search pod上转发 的。


插件方式 安装如下,没有测试过
https://github.com/vvanholl/elasticsearch-prometheus-exporter
安装elasticSearch exporter
elastic exporter 既可以安装在 elastic search 集群之外,也可以以 插件的方式 安装 在 elastic search 集群 本次测试 是通过 k8s 上的 elastic search pod上转发 的。
插件方式 安装如下,没有测试过 https://github.com/vvanholl/elasticsearch-prometheus-exporter
因为手头有现成的K8s集群,所以直接用 K8s来部署 elasticSearch exporter。
helm 安装
wsg@ubuntu16:~$ helm list
NAME                      	NAMESPACE	REVISION	UPDATED                                	STATUS  	CHART                       	APP VERSION
wsg-elasticsearch-exporter	default  	6       	2020-01-09 13:23:43.138234993 +0800 CST	deployed	elasticsearch-exporter-2.1.1	1.1.0
wsg@ubuntu16:~$
配置exproter,需要更新 helm包中的配置文件,指定es集群为实际的 es集群ip,如下
es:
  ## Address (host and port) of the Elasticsearch node we should connect to.
  ## This could be a local node (localhost:9200, for instance), or the address
  ## of a remote Elasticsearch server. When basic auth is needed,
  ## specify as: <proto>://<user>:<password>@<host>:<port>. e.g., http://admin:pass@localhost:9200.
  ##
  uri: http://172.17.73.61:9200
安装完可以查看对应pod运行情况
wsg@ubuntu16:~$ kubectl get pods
NAME                                                          READY   STATUS    RESTARTS   AGE
wsg-elasticsearch-exporter-67cc57bbc8-hx8hr                   1/1     Running   2          19d
wsg-jenkins-8484fdb7dd-69fqh                                  0/1     Pending   0          26d
wsg-prometheus-operator-grafana-545655b77f-j2zcm              2/2     Running   4          19d
进一步查看该pod 详细信息(包括对外的端口),可以看到 该pod已经指定了ES的ip,172.17.73.61
wsg@ubuntu16:/mnt/prometheus_data/prometheus/prometheus-2.12.0.linux-amd64$ kubectl describe pod wsg-elasticsearch-exporter-67cc57bbc8-hx8hr
Name:               wsg-elasticsearch-exporter-67cc57bbc8-hx8hr
Namespace:          default
Priority:           0
PriorityClassName:  <none>
Node:               ubuntu16/172.17.73.68
Start Time:         Sun, 19 Jan 2020 03:43:12 +0800
Labels:             app=elasticsearch-exporter
                    pod-template-hash=67cc57bbc8
                    release=wsg-elasticsearch-exporter
Annotations:        <none>
Status:             Running
IP:                 10.32.0.46
Controlled By:      ReplicaSet/wsg-elasticsearch-exporter-67cc57bbc8
Containers:
  elasticsearch-exporter:
    Container ID:  docker://a1e9f196e30c39fe03190b739810dc7b5dfd0cde5d8e881e5d61c20be65985d2
    Image:         justwatch/elasticsearch_exporter:1.1.0
    Image ID:      docker-pullable://justwatch/elasticsearch_exporter@sha256:0f94474f46a917d85657ee62ad6d01d30128198ed048014caf5471b9b7151b45
    Port:          9108/TCP
    Host Port:     0/TCP
    Command:
      elasticsearch_exporter
      --es.uri=http://172.17.73.61:9200
      --es.all
      --es.indices
      --es.indices_settings
      --es.shards
      --es.snapshots
      --es.timeout=30s
      --web.listen-address=:9108
      --web.telemetry-path=/metrics
安装promethues
go binary 文件,可以直接运行
wsg@ubuntu16:/mnt/prometheus_data/prometheus/prometheus-2.12.0.linux-amd64$ pwd
/mnt/prometheus_data/prometheus/prometheus-2.12.0.linux-amd64
wsg@ubuntu16:/mnt/prometheus_data/prometheus/prometheus-2.12.0.linux-amd64$ ll
total 132260
drwxr-xr-x 4 wsg wsg     4096 Jan  9 17:52 ./
drwxrwxr-x 3 wsg wsg     4096 Jan  9 17:48 ../
drwxr-xr-x 2 wsg wsg     4096 Jan  9 17:48 console_libraries/
drwxr-xr-x 2 wsg wsg     4096 Jan  9 17:48 consoles/
-rw-r--r-- 1 wsg wsg    11357 Jan  9 17:48 LICENSE
-rw-r--r-- 1 wsg wsg     2770 Jan  9 17:48 NOTICE
-rwxr-xr-x 1 wsg wsg 84771664 Jan  9 17:48 prometheus*
-rw-r--r-- 1 wsg wsg     1025 Jan  9 17:52 prometheus.yml
-rwxr-xr-x 1 wsg wsg 50620988 Jan  9 17:48 promtool*
wsg@ubuntu16:/mnt/prometheus_data/prometheus/prometheus-2.12.0.linux-amd64$


运行命令,指定数据存储路径
sudo  ./prometheus \
    --config.file /mnt/prometheus_data/prometheus/prometheus-2.12.0.linux-amd64/prometheus.yml \
    --storage.tsdb.path /mnt/prometheus_data/data \
    --web.console.templates=/mnt/prometheus_data/prometheus/prometheus-2.12.0.linux-amd64/consoles \
    --web.console.libraries=/mnt/prometheus_data/prometheus/prometheus-2.12.0.linux-amd64/console_libraries
注意其中的配置文件,增加了对 elasticsearch-exporter-pod 信息的收集(配置中用了localhost的配置,前提是我们已经将 pod的端口转发到了该host上, 命令如下:(更正式的做法是通过service或者nodePort的方式来把容器的服务开发给外部。)
wsg@ubuntu16:~$ kubectl port-forward wsg-elasticsearch-exporter-67cc57bbc8-hx8hr  9108:9108
Forwarding from 127.0.0.1:9108 -> 9108
Forwarding from [::1]:9108 -> 9108
Handling connection for 9108
将pod的9108端口转发到 host上的9108后,就可以正常启动 Prometheus,完整的配置文件如下:
wsg@ubuntu16:/mnt/prometheus_data/prometheus/prometheus-2.12.0.linux-amd64$ cat prometheus.yml
# my global config
global:
  scrape_interval:     15s # Set the scrape interval to every 15 seconds. Default is every 1 minute.
  evaluation_interval: 15s # Evaluate rules every 15 seconds. The default is every 1 minute.
  # scrape_timeout is set to the global default (10s).

# Alertmanager configuration
alerting:
  alertmanagers:
  - static_configs:
    - targets:
      # - alertmanager:9093

# Load rules once and periodically evaluate them according to the global 'evaluation_interval'.
rule_files:
  # - "first_rules.yml"
  # - "second_rules.yml"

# A scrape configuration containing exactly one endpoint to scrape:
# Here it's Prometheus itself.
scrape_configs:
  # The job name is added as a label `job=<job_name>` to any timeseries scraped from this config.
  - job_name: 'prometheus'

    # metrics_path defaults to '/metrics'
    # scheme defaults to 'http'.

    static_configs:
    - targets: ['localhost:9090']


  - job_name: 'elasticsearch-export-pod'
    static_configs:
    - targets: ['localhost:9108']

wsg@ubuntu16:/mnt/prometheus_data/prometheus/prometheus-2.12.0.linux-amd64$
查看ES监控数据
可以看到exporter开放出来的指标很多,需要对这些指标有大概的了解之后,才能使用这些指标 构建出一个 易于观看的dashboard
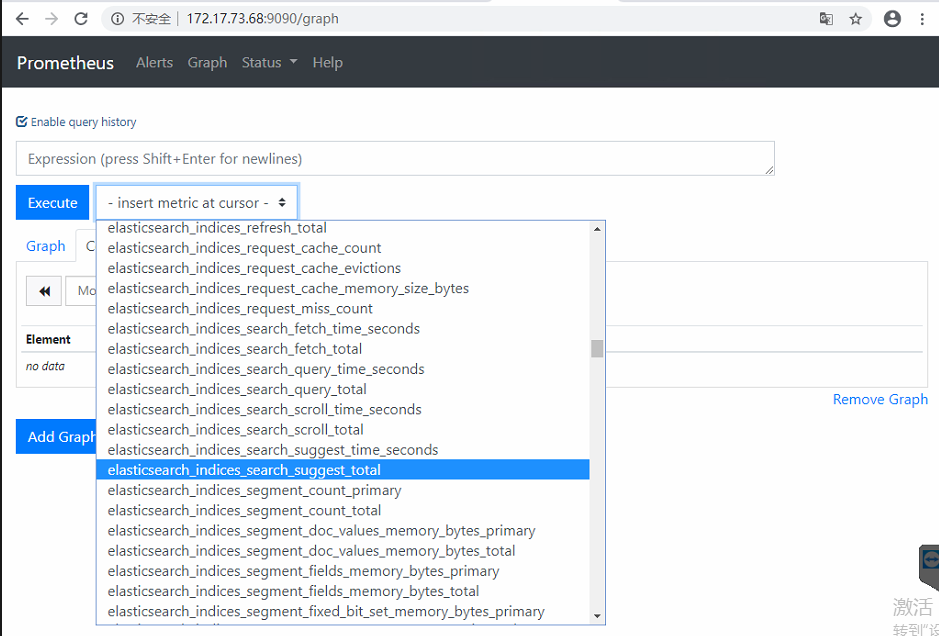
存在的不足:es相关指标太多,组织起来,如何展示等,比较费事。
xpack解决方案
x-pack是ES自己开源出来的解决方案,安装包里已经自带,只要在 kibana界面打开相应的开关就可以使用了。
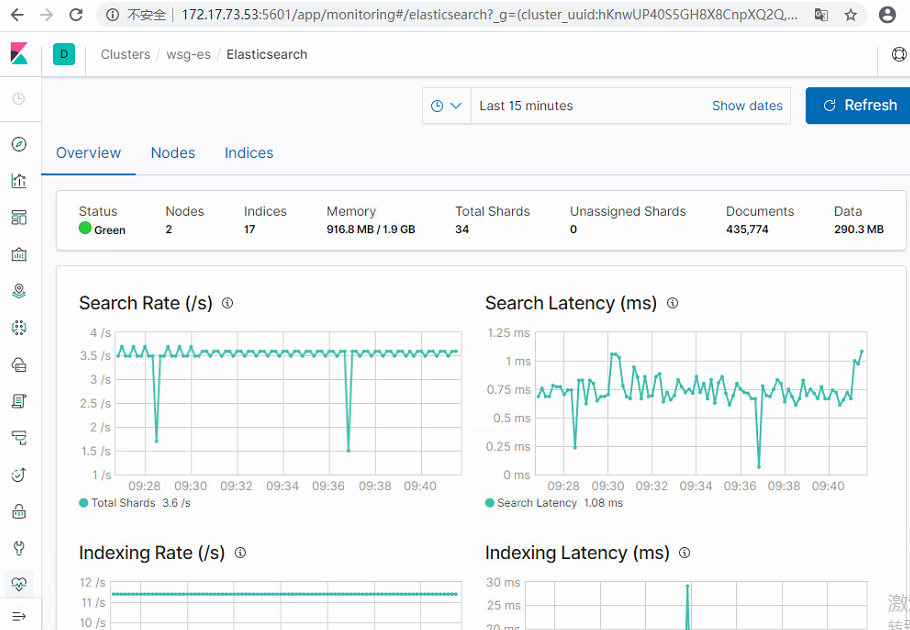
相关效果如下,可以看到集群层面的信息和节点的信息
集群层面监控
可以进一步查看每个节点的资源消耗情况
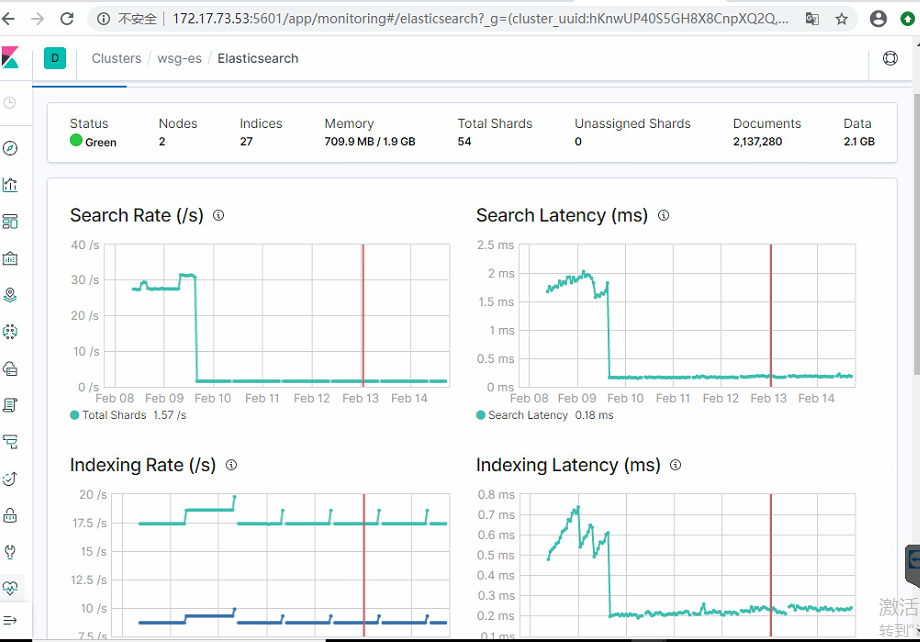
查看过去7天的集群趋势变化情况
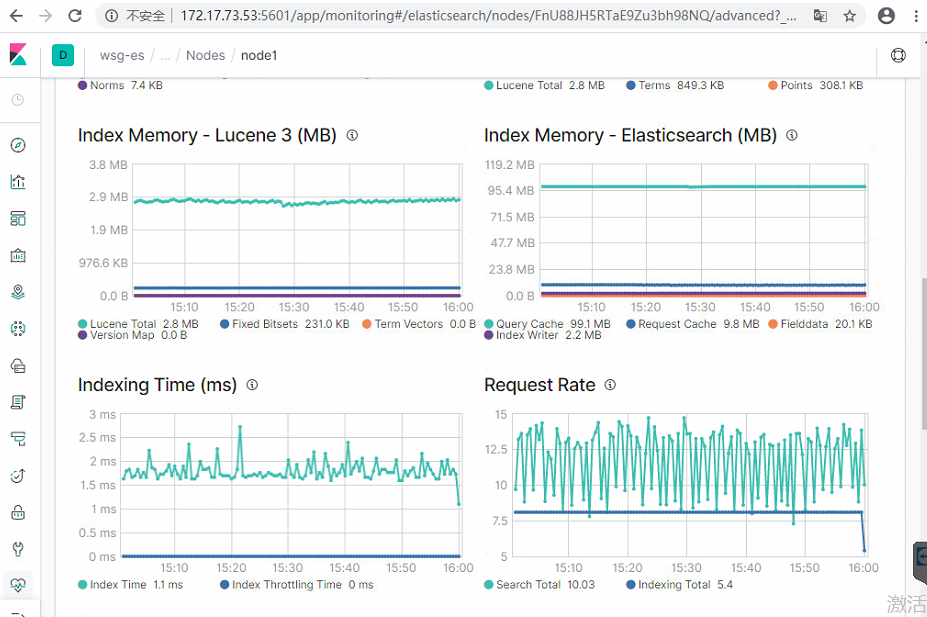
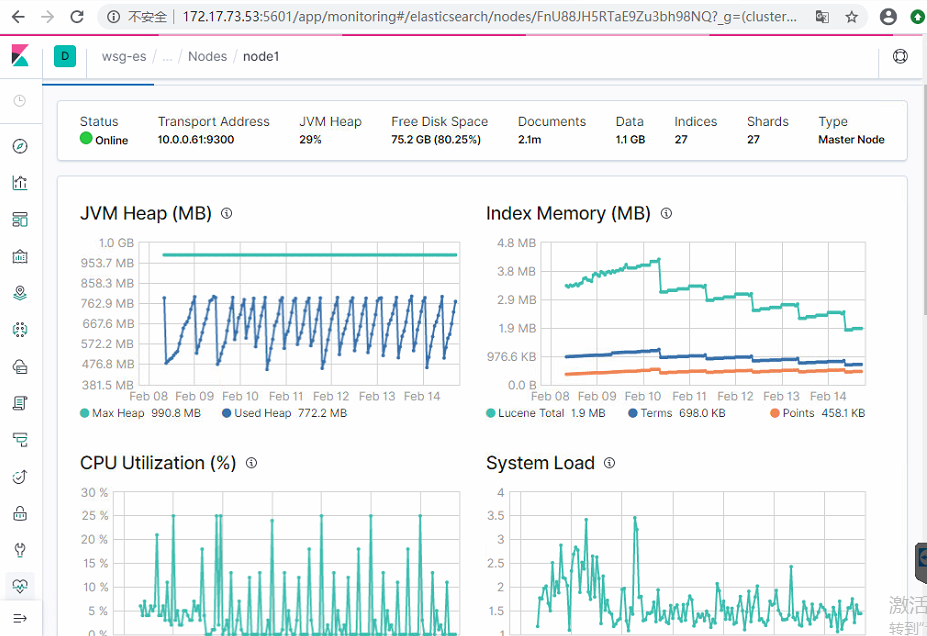
节点层面监控
节点资源消耗的趋势 变化
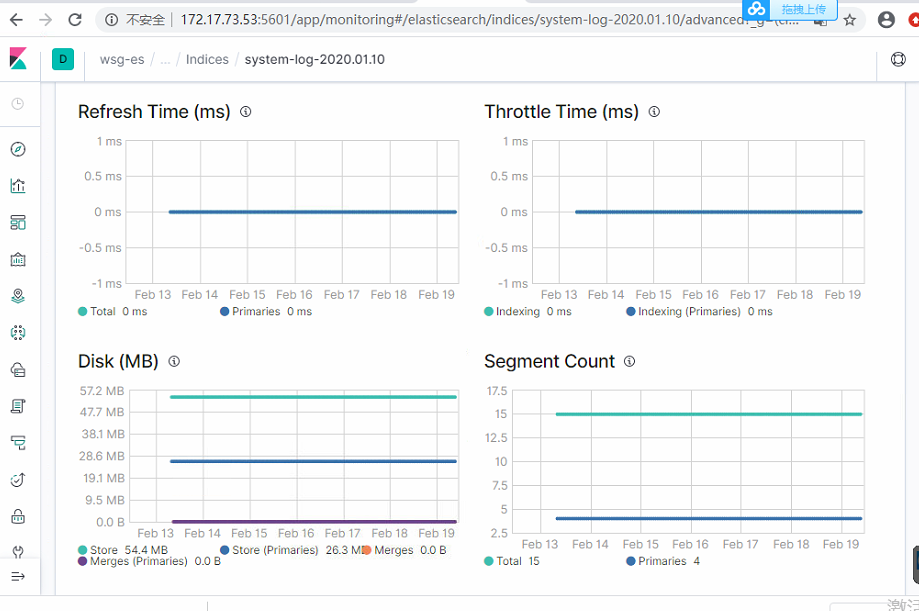
index 层面监控
可以看到 index的内存和磁盘占用情况, segment数量,refresh 情况,等
参考
https://www.elastic.co/guide/en/cloud-on-k8s/current/k8s-quickstart.html
http://developer.51cto.com/art/201904/594615.htm
故障处理记录
prometheus 无法监控到 es exporter
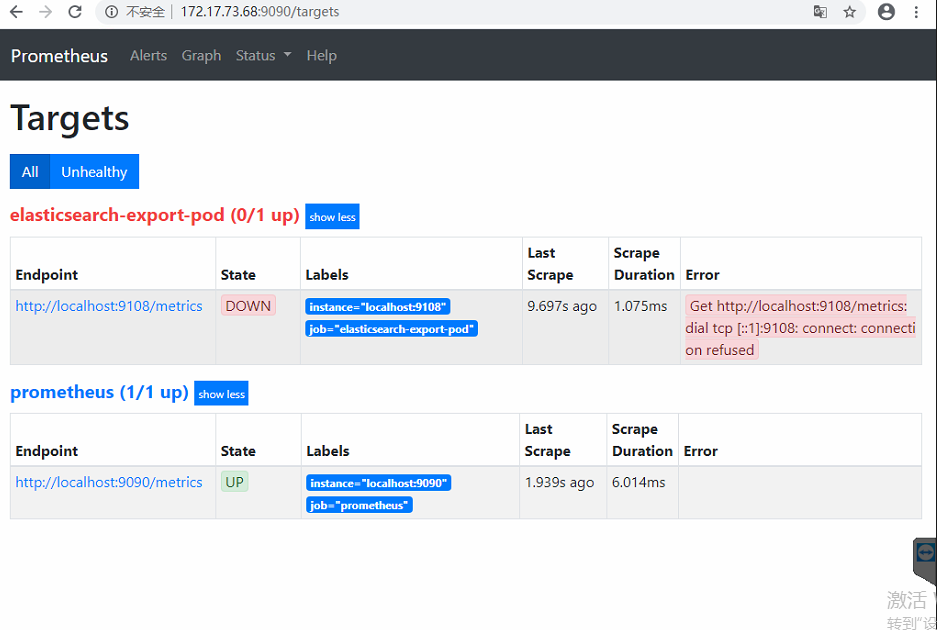
原因是,expoter 位于k8s 集群的pod,host节点不可以直接访问,一开始部署的时候为了简单测试,当时使用了port-forward,将pod的端口转发到了 host上。
主流的做法应该是通过 service 或者 nodePort的方式来访问。
先临时 使用port-forwad wsg@ubuntu16:~$ kubectl port-forward wsg-elasticsearch-exporter-67cc57bbc8-hx8hr 9108:9108
下图是正常监控的情况
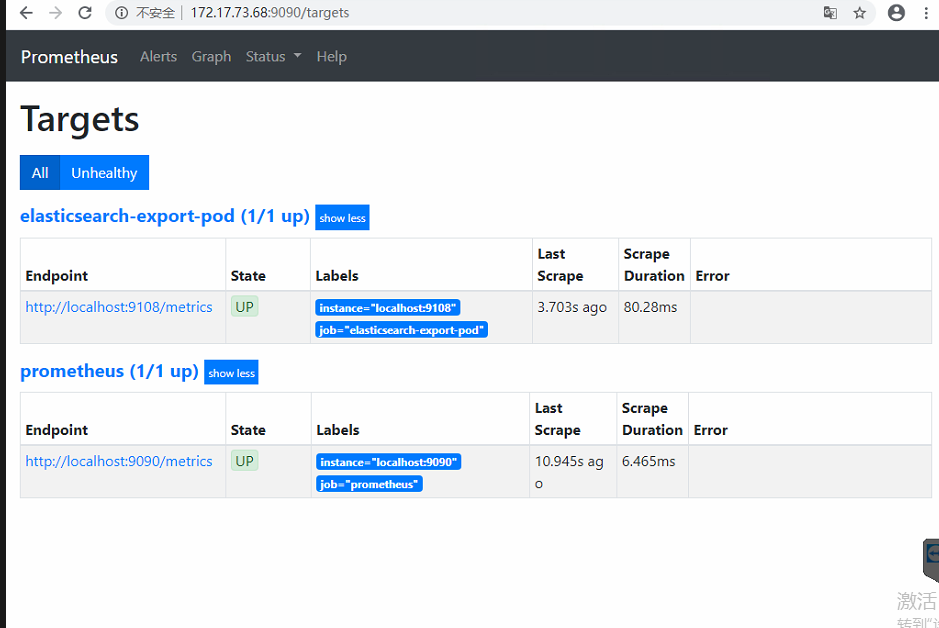
?